Get to know New Relic Reporting for WordPress
![]() Vasken Hauri on
Vasken Hauri on
New Relic is a SaaS product that offers application performance monitoring (APM), which provides developers with real-time data for use in proactive diagnostics as well as debugging. This data—including basic information about WordPress hooks, plugins, and themes—can be queried and visualized using the New Relic Insights dashboard.
Seeing an opportunity to maximize the utility of APM and Insights, we created New Relic Reporting for WordPress, which supplements out-of-the-box data collection with additional WordPress-specific information.
New Custom Attributes
New Relic APM’s “transaction traces” are the foundation for its detailed insight into application performance. These traces record each step (transaction) along the path to satisfy an application request, such as a website page request. Each recorded transaction includes a number of attributes—metadata about the transaction—such as its time and date. Our plugin adds and extends attributes for the transaction data logged in New Relic, to aid debugging and performance analytics.
While our technical documentation is more detailed, at the high level, our plugin adds the following transaction attributes:
- User data. Whether a logged in WordPress user was executing the transaction, and if so, the ID of the user.
- Post ID. If a single post was being requested, the ID of that post.
- Template. If a theme template was being requested, the file path for the template.
- Theme. The name of the theme in use at the time of the transaction.
- Request type. Whether the transaction was made as part of a standard web request (most common), an AJAX request, or a CLI request. New request types can be added using a filter (wp_nr_request_type).
- Runtime of async tasks. Tracks the runtime of Gearman async tasks, building on our WP-Gears work.
Our plugin also improves reporting for some existing, key attributes:
- Transaction name. Adds more recognizable names for common WordPress application requests, e.g. website “Front Page” or admin “Dashboard”, in lieu of generic transaction names like “index.php”.
- Error messages. Log errors/notices for the current transaction with a new PHP function.
More granular debugging
The additional custom attributes we attach to transaction traces empowers engineers to better diagnose unusual site behavior. As an example, let’s look at how our plugin can assist in debugging a common scenario: complaints by an editor that the site is loading slowly.
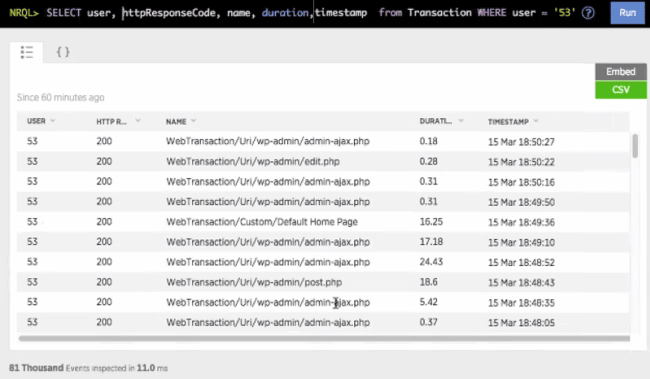
When someone reports slow page loads, we can query New Relic Insights for slow transactions using New Relic’s ‘duration’ attribute. Because our plugin adds a custom attribute identifying the WordPress user to each transaction, the engineer can investigate whether the performance is isolated to logged in users, and even determine whether it’s localized to specific users. We can include the WordPress user as a column in the transaction results, or refine the query to be limited to users who are (or are not) logged in, even restricting results to a specific user ID (perhaps the user who reported the problem).
In the below screenshot, we queried for some important attributes, including duration, for all transactions by WordPress user ID 53, ordered reverse chronological by the timestamp (date and time of transaction) attribute.
Pinpoint trends before they become problems
While duration is a standard New Relic attribute, query results are, by default, limited to attributes that make it difficult to correlate slow times with specific site usage patterns in WordPress. By adding details like the category name to the transaction name attribute, New Relic can report on load times for category pages, enabling developers to more quickly recognize patterns associated with atypical performance before they become major issues.
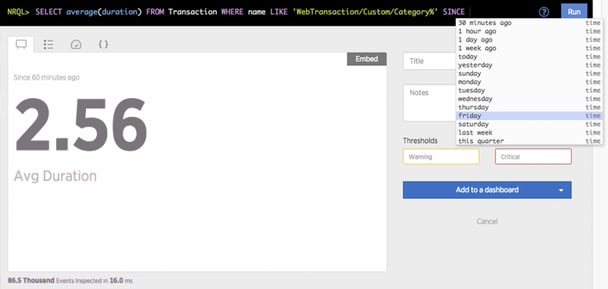
Queries like this one—the average duration for categories—can be embedded in the New Relic Insights dashboard, keeping developers up-to-date with real-time data at a glance. By adding warning and critical performance thresholds, support engineers can actively track site performance to proactively remedy trends before they affect site visitor experiences.
Learn more about, or download, New Relic Reporting for WordPress from GitHub or WordPress.org.